
High-volume clinical laboratories process thousands of test results every day. Among those results are critical values that require prompt communication to the responsible healthcare providers. At Cleveland Clinic's Center for Pathology Informatics, an opportunity existed to improve the visibility and monitoring of critical laboratory results awaiting caregiver notification.
Project overview
As Principal Developer, Gene Farber contributed to the development of a real-time Critical Values Monitoring System designed to identify pending critical results automatically and make them visible to laboratory personnel through a centralized monitoring interface.
The solution integrated with the existing laboratory information system, continuously monitored result statuses, and provided visual alerts to help laboratory staff prioritize outstanding notifications.
The project demonstrated how custom enterprise software and systems integration could improve an important clinical workflow without requiring replacement of the underlying laboratory information system.
The challenge
Laboratory personnel needed a reliable way to identify critical test results that had not yet been communicated to the responsible caregiver. In a high-volume environment, relying exclusively on conventional workflows to identify pending notifications could make it difficult to maintain consistent visibility into outstanding results.
The objective was to develop an automated monitoring solution that could:
- Continuously identify critical laboratory results requiring notification.
- Monitor whether results had been marked as communicated.
- Provide immediate visual awareness of newly detected critical values.
- Escalate visibility when a result remained unreported.
- Integrate with the existing laboratory information system.
- Support configurable monitoring parameters for additional test types.
The solution: automated critical values monitoring
The application was built using Microsoft .NET, Microsoft Internet Information Services (IIS), and SQL Server, integrating with the Sunquest Laboratory Information System. The architecture consisted of two primary components.
1. Automated monitoring controller
A controller application continuously queried the laboratory information system to identify critical results that had not been marked as communicated. Results requiring notification were stored for monitoring and made available to the presentation layer.
This automated process eliminated the need for laboratory personnel to rely solely on manually checking for outstanding critical results.
2. Real-time web-based monitoring dashboard
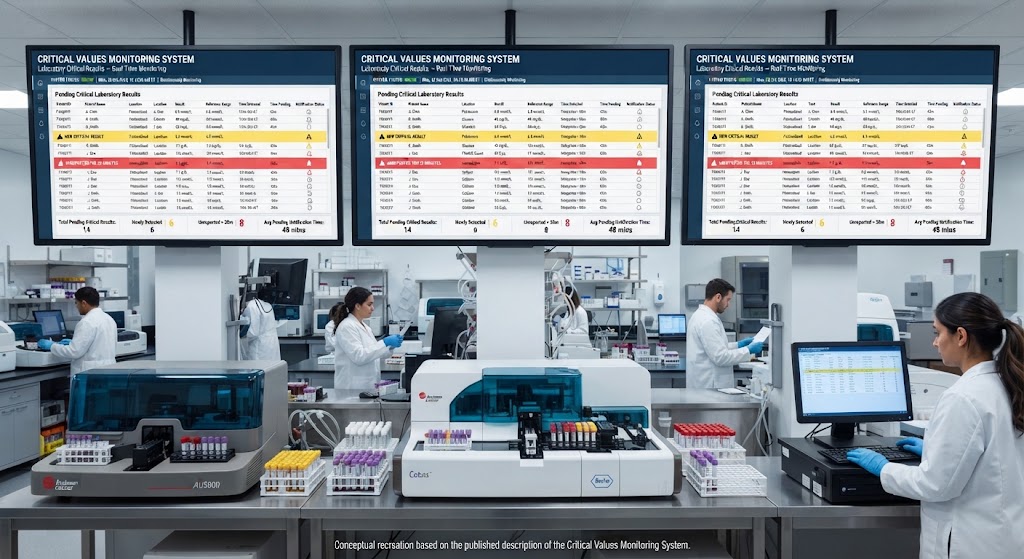
A centralized web-based dashboard displayed pending critical results on large monitors within the laboratory. Color-coded visual indicators communicated the status and urgency of each result:
| Indicator | Meaning |
|---|---|
| Yellow | Newly detected critical result requiring notification. |
| Red | Critical result remaining unreported after 30 minutes. |
When laboratory personnel completed the caregiver notification, they entered a predefined result modifier into the laboratory information system. The monitoring application detected the updated status and removed the result from the display.
The application also supported configurable parameters, allowing additional test types to be incorporated into the monitoring process.
How it worked
The monitoring loop stayed inside the laboratory's existing systems. The controller read from the laboratory information system; the dashboard read from the monitoring store. No step required a replacement of the core clinical platform.
- A critical result is recorded in the laboratory information system.
- The monitoring controller queries the system for results not marked as communicated.
- Pending results are stored and made available to the presentation layer.
- The dashboard displays the alert, and clears it once notification is recorded.
Technology architecture
| Component | Technology |
|---|---|
| Application development | Microsoft .NET and C# |
| Application hosting | Microsoft Internet Information Services (IIS) |
| Database | Microsoft SQL Server |
| Laboratory integration | Sunquest Laboratory Information System |
| User interface | Web-based monitoring dashboard |
| Data monitoring | Automated, continuous result-status queries |
The architecture allowed the monitoring application to operate alongside the existing laboratory information system, providing additional functionality without replacing the core clinical platform.
Measurable results
Published research evaluated the system's performance over a six-month period. During that period, the application processed more than 3.5 million laboratory results, analyzed an average of approximately 835 results per hour across a 24-hour cycle, and displayed an average of approximately 1.7 critical results per hour requiring notification.
3.5M+
laboratory results
Processed during the six-month evaluation period.
~835
results per hour
Average analyzed across a 24-hour cycle.
~1.7
critical results per hour
Average requiring notification during the period.
Researchers compared critical-result callback target performance with the corresponding six-month period before implementation.
| Performance measure | Before | After |
|---|---|---|
| Outpatient callback targets met | 3 of 6 months | 5 of 6 months |
| Inpatient callback targets met | 5 of 6 months | 6 of 6 months |
These findings demonstrated improved attainment of the laboratory's callback targets following implementation.
Reading the figures. The averages and the before-and-after comparison are those reported in the published research abstract. They describe a six-month evaluation at Cleveland Clinic, not a benchmark that transfers unchanged to another laboratory.
Professional recognition
The work was presented in the published pathology informatics research abstract:
Research abstract
Real-Time Detection and Display of Critical Values in the Laboratory Improves Caregiver Notifications
The project was also recognized by the Association for Pathology Informatics. Its annual report lists Eugene Farber as the winner in the Decision Support – Applied Informatics and Clinical Workflow category.
This recognition highlighted the practical application of software engineering to an important clinical workflow.
Engineering experience that applies beyond healthcare
The engineering principles behind this project extend well beyond clinical laboratory environments. Manufacturing companies face many of the same underlying technology challenges:
- Collecting operational data from multiple systems and equipment sources.
- Monitoring events and identifying exceptions in real time.
- Integrating disconnected applications and databases.
- Making important operational information visible to the right people.
- Automating workflows that previously depended on manual intervention.
- Modernizing existing systems without disrupting critical operations.
These are the kinds of challenges Expert Tech Pilot helps businesses address today. Today, Gene Farber brings this experience to Expert Tech Pilot, providing direct access to senior-level software architecture and engineering expertise.
For mid-sized businesses, this means access to experienced technical leadership without the multiple layers, overhead, and communication delays often associated with large consulting organizations.
Original research and references
Original research
Real-Time Detection and Display of Critical Values in the Laboratory Improves Caregiver Notifications
Historical project attribution. Work described in this case study was performed at Cleveland Clinic's Center for Pathology Informatics, where Gene Farber served as Principal Developer.